
In Part 1, we discussed why datasheets can be misleading and why, even though an industry standard is not realistic, EAW needed to develop a rock-solid internal standard that enabled us to move into more advanced areas of development.
In Part 2, we will discuss these more advanced design tools in some detail. While most of the industry knows that Resolution™ is our modeling software system, only a certain portion is aware of a piece of software called F-Chart™ that is the mathematical genius behind our entire process.
How F-Chart Works
In 1997, when EAW was developing the KF900 system, we relied on a new piece of EAW-produced software called F-Chart. F-Chart enabled EAW engineers to combine data from multiple drivers as would occur in an array and predict total array response at a range of points along the vertical axis.
The key to this process as outlined in the KF900 / Phased Point Source Technology white paper was to accurately capture in situ data from each individually processed transducer at each of the points along the vertical axis. It was critical to know the precise distance from each transducer (acoustic origin) to the microphone relative to all other transducers.
After acquiring this complex data set for each transducer in each enclosure that would comprise an array, F-Chart would set to work manipulating available signal processing parameters to normalize response at all vertical locations. So at its core, F-Chart is a goal-seeking program.
At first, F-Chart took hours and sometimes days to develop DSP settings, and the results more-or-less matched the predictions. Over the first few years working with it, EAW engineers improved the system to more rapidly develop DSP settings that truly optimized response at all locations, closely matching the prediction.
As we suggested in Part 1, F-Chart was only as accurate as the data that served as its input. Specifically, EAW engineers would need to acquire any data that might ever become F-Chart input using an identical methodology. Thus we developed S3 as an internal data acquisition standard.
Why Create Resolution?
As the years passed, software became a common part of the pro audio industry. Platforms like EASE and SMAART became de facto standards for acoustical modeling and field testing and optimization, respectively. While accurate and powerful, the costs and complexity associated with EASE made it a tool only for high-end consultants and design/integrators. Certainly, it was no help to touring professionals who needed immediate answers to basic performance questions.
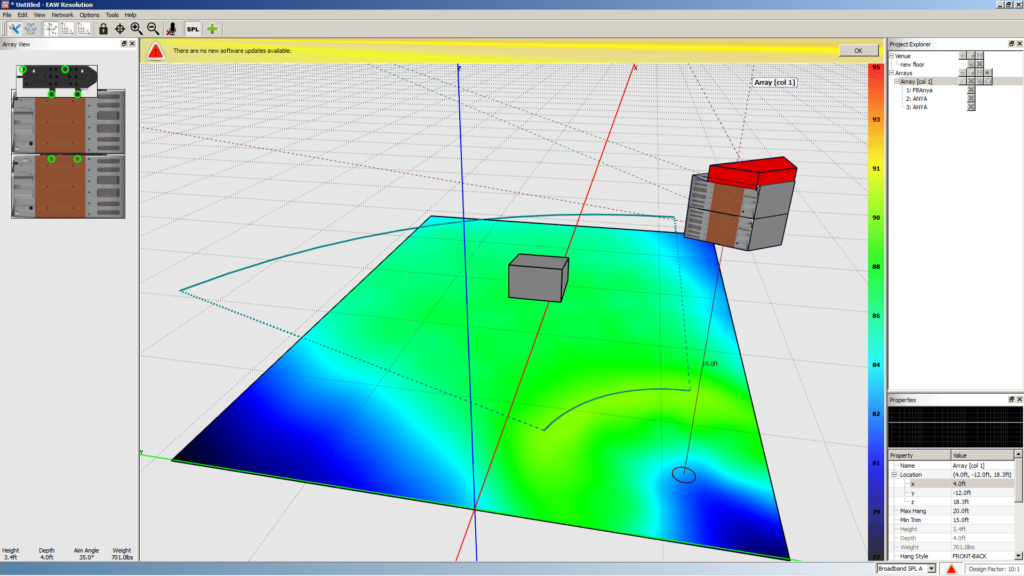
It was this experience – measuring the output of an actual array that nearly exactly matched the Resolution prediction – that inspired FOH engineer Martin Frey to approach EAW about participating in the then-in-development EAW Red Certification™ training program. Martin eventually endorsed the KF740 and Red Certification process because it delivered consistently accurate results every time.EAW developed Resolution as an easy-to-use program that delivers accurate “first arrival” information for a range of EAW line array systems, like the KF760 and KF740. Using F-Chart as the basic acoustical modeling engine, Resolution could almost instantly show the total response of an array comprising previously measured modules. And it could do so with amazing accuracy as we proved time and time again in venues around the world.
Resolution also includes a mechanical engineering section that provides information on load safety for a given design factor. It also provides instructions on building and suspending loudspeaker arrays, specifying module-to-module angles, appropriate pin locations, etc.
F-Chart as Virtual Designer
Some industry watchers know about F-Chart and its relationship to Resolution. Few have ever known until now that EAW engineers themselves came to rely on F-Chart not to predict the performance of line array systems but as a virtual loudspeaker design tool. Once we had proven the accuracy of the modeling calculations, EAW engineers began feeding S3 measured data of components from loudspeaker systems still in development into F-Chart. Using the modeling engine, engineers could examine the changes in response created by various changes to the system’s design.
This innovation greatly accelerated the pace of development at EAW, increasing the amount of improvement in each iterative cycle. Each new prototype created would advance any given project as much as several iterative cycles without F-Chart.
More importantly, the use of F-Chart to develop loudspeakers themselves (not just to model array performance) serves as the ultimate testament to the accuracy both of the S3 data acquisition process and the prediction engine itself.
The core mathematical formulas behind F-Chart come directly from fully-vetted academic literature. These have been available to researchers for decades, and surely any errors would have come to light by now. Thus the only variable affecting the accuracy of modeled predictions in Resolutions is the quality of the input data.
Because the S3 process ensures that EAW acquires each and every data set using an identical methodology, all data are comparatively accurate. By repeatedly confirming predictions with real-world measurements, EAW engineers proved some years ago that all aspects of this technology deliver accurate information within the practical limits imposed by technology and conditions.
In Part 3 of this series, we will discuss the specific advances that Anya enables and why Anya defies the notion of a traditional data sheet. As discussed in Part 1, data sheets, at their best, answer the question, “What can this loudspeaker do?”
With Anya, that question has an infinite number of answers. So we answer the question with a question:
What do you need the loudspeaker to do?